Why ROI Is the Wrong Question for Community Colleges and Workforce Programs
Why a single metric obsession is damaging to the very outcome it is meant to convey

In the recent times, the value of college has increasingly been framed around a single metric: return on investment.
Did graduates earn more money after attending college?
It sounds reasonable. But this framing quietly assumes something that isn’t actually true: that education produces a single, predictable financial return.
Real careers don’t work like that.
Two students can graduate from the same program and end up in completely different places ten years later. One might start modestly and climb quickly. Another may start higher but plateau. Someone else may pivot industries entirely or eventually start their own business.
Reducing all of that to a median wage strips away the thing that actually matters most:
how careers evolve over time.
If we want to understand the economic impact of college programs, we need to look at two things instead:
• career ladders — how earnings grow over time
• earnings variance — how much outcomes differ across graduates
Together, those two dimensions tell a far richer story than ROI ever could.
The Data Problem — and Why It’s Changing
For a long time, understanding what happens to students after graduation was surprisingly difficult. Colleges had very little reliable data on where graduates ended up or how their earnings evolved over time.
This question has become even more important as policymakers focus on workforce programs, short-term credentials, and initiatives like Workforce Pell, which expand federal aid eligibility to shorter career-focused training, much of it delivered by community colleges.
That picture is starting to change. Several new data sources now offer visibility into workforce outcomes.
Each provides useful insight, but also has important limitations.
State Education Department Data
One of the first places I encountered workforce outcomes data was through state education department reports. In Colorado, for example, the state publishes program-level earnings using administrative wage records.
At first glance, this looks incredibly promising. But a closer look reveals some important constraints. Only graduates earning above a minimum-wage threshold are included in the percentile calculations, which removes the lower tail of the earnings distribution. That raises a basic question: how can we understand the true value of a program if the lowest earners are excluded from the analysis?
The data also attributes outcomes only to a person’s highest credential earned, making it difficult to observe the contribution of earlier certificates or stackable credentials along a career path. Like most wage record systems, it can also miss some self-employment.
Lightcast Alumni Career Data
Another promising source comes from alumni career datasets such as those produced by Lightcast. These datasets assemble employment histories using resumes, professional profiles, and other public web data.
What makes them valuable is the context they provide. Unlike wage records, they can show occupations, industries, and career transitions.
But coverage varies widely across fields. Graduates working in professional and technical services are much more likely to have an online footprint, while workers in skilled trades, service occupations, and many short-term certificate fields are much harder to observe.
As a result, these datasets often underrepresent exactly the kinds of programs community colleges tend to specialize in.
Post-Secondary Employment Outcomes: The Quiet Superpower
The dataset that really changed the game for me is the Post-Secondary Employment Outcomes (PSEO) dataset. PSEO links institutional student records to federal administrative wage data through the LEHD system, connecting graduates to actual earnings observed in the labor market.
Unlike many state workforce datasets, PSEO also captures graduates who move across state lines, providing a much more complete picture of career mobility.
What makes the dataset especially useful is how outcomes are reported. Instead of a single wage number, PSEO reports earnings 1, 5, and 10 years after graduation and includes earnings percentiles, allowing us to see both career progression and the spread of outcomes.
Like most administrative wage datasets, PSEO does exclude self-employment income, which can understate earnings in fields where independent work is common. Even so, it remains one of the most powerful tools available for understanding how education translates into real careers.
But data alone doesn’t answer the question. The real value comes from how we choose to measure outcomes.
Using PSEO, two simple metrics help reveal patterns that a single ROI number hides.
Metric 1: Career Ladders
Instead of reducing outcomes to a single wage number, we can look at career ladders: earnings 1, 5, and 10 years after graduation using PSEO data.
Some programs start modestly but show strong upward mobility. Others begin with higher wages but grow more slowly. Both can represent successful outcomes, but they reflect very different career trajectories.
Metric 2: Earnings Variance
The second metric is earnings variance.
PSEO reports the 25th and 75th percentiles, allowing us to measure the spread of outcomes within a program. Narrow ranges suggest more predictable wages, while wider ranges indicate more diverse paths, often with both lower floors and higher ceilings.
This often reflects the structure of the underlying occupation. Fields like nursing, where roles are tightly defined and credentials map directly to specific jobs, tend to show relatively narrow ranges. Other fields, particularly in business, technology, or technical trades, often show much wider dispersion as graduates move into different roles, industries, or advancement paths.
Variance therefore adds a second dimension to program outcomes: risk, upside, and opportunity.
Case Study: Colorado’s Front Range Community College
Using PSEO data, we can examine how graduates from Colorado’s Front Range Community College (FRCC) progress over time.

Several patterns emerge. Some technical programs, particularly engineering technologies and information systems, start strong and continue climbing over time. Others begin more modestly but show steady growth toward or above the Colorado living-wage benchmark by year ten. A few plateau earlier, illustrating how different credentials translate into very different career trajectories.
But the ladder alone doesn’t tell the whole story. Outcomes within the same program can vary substantially.
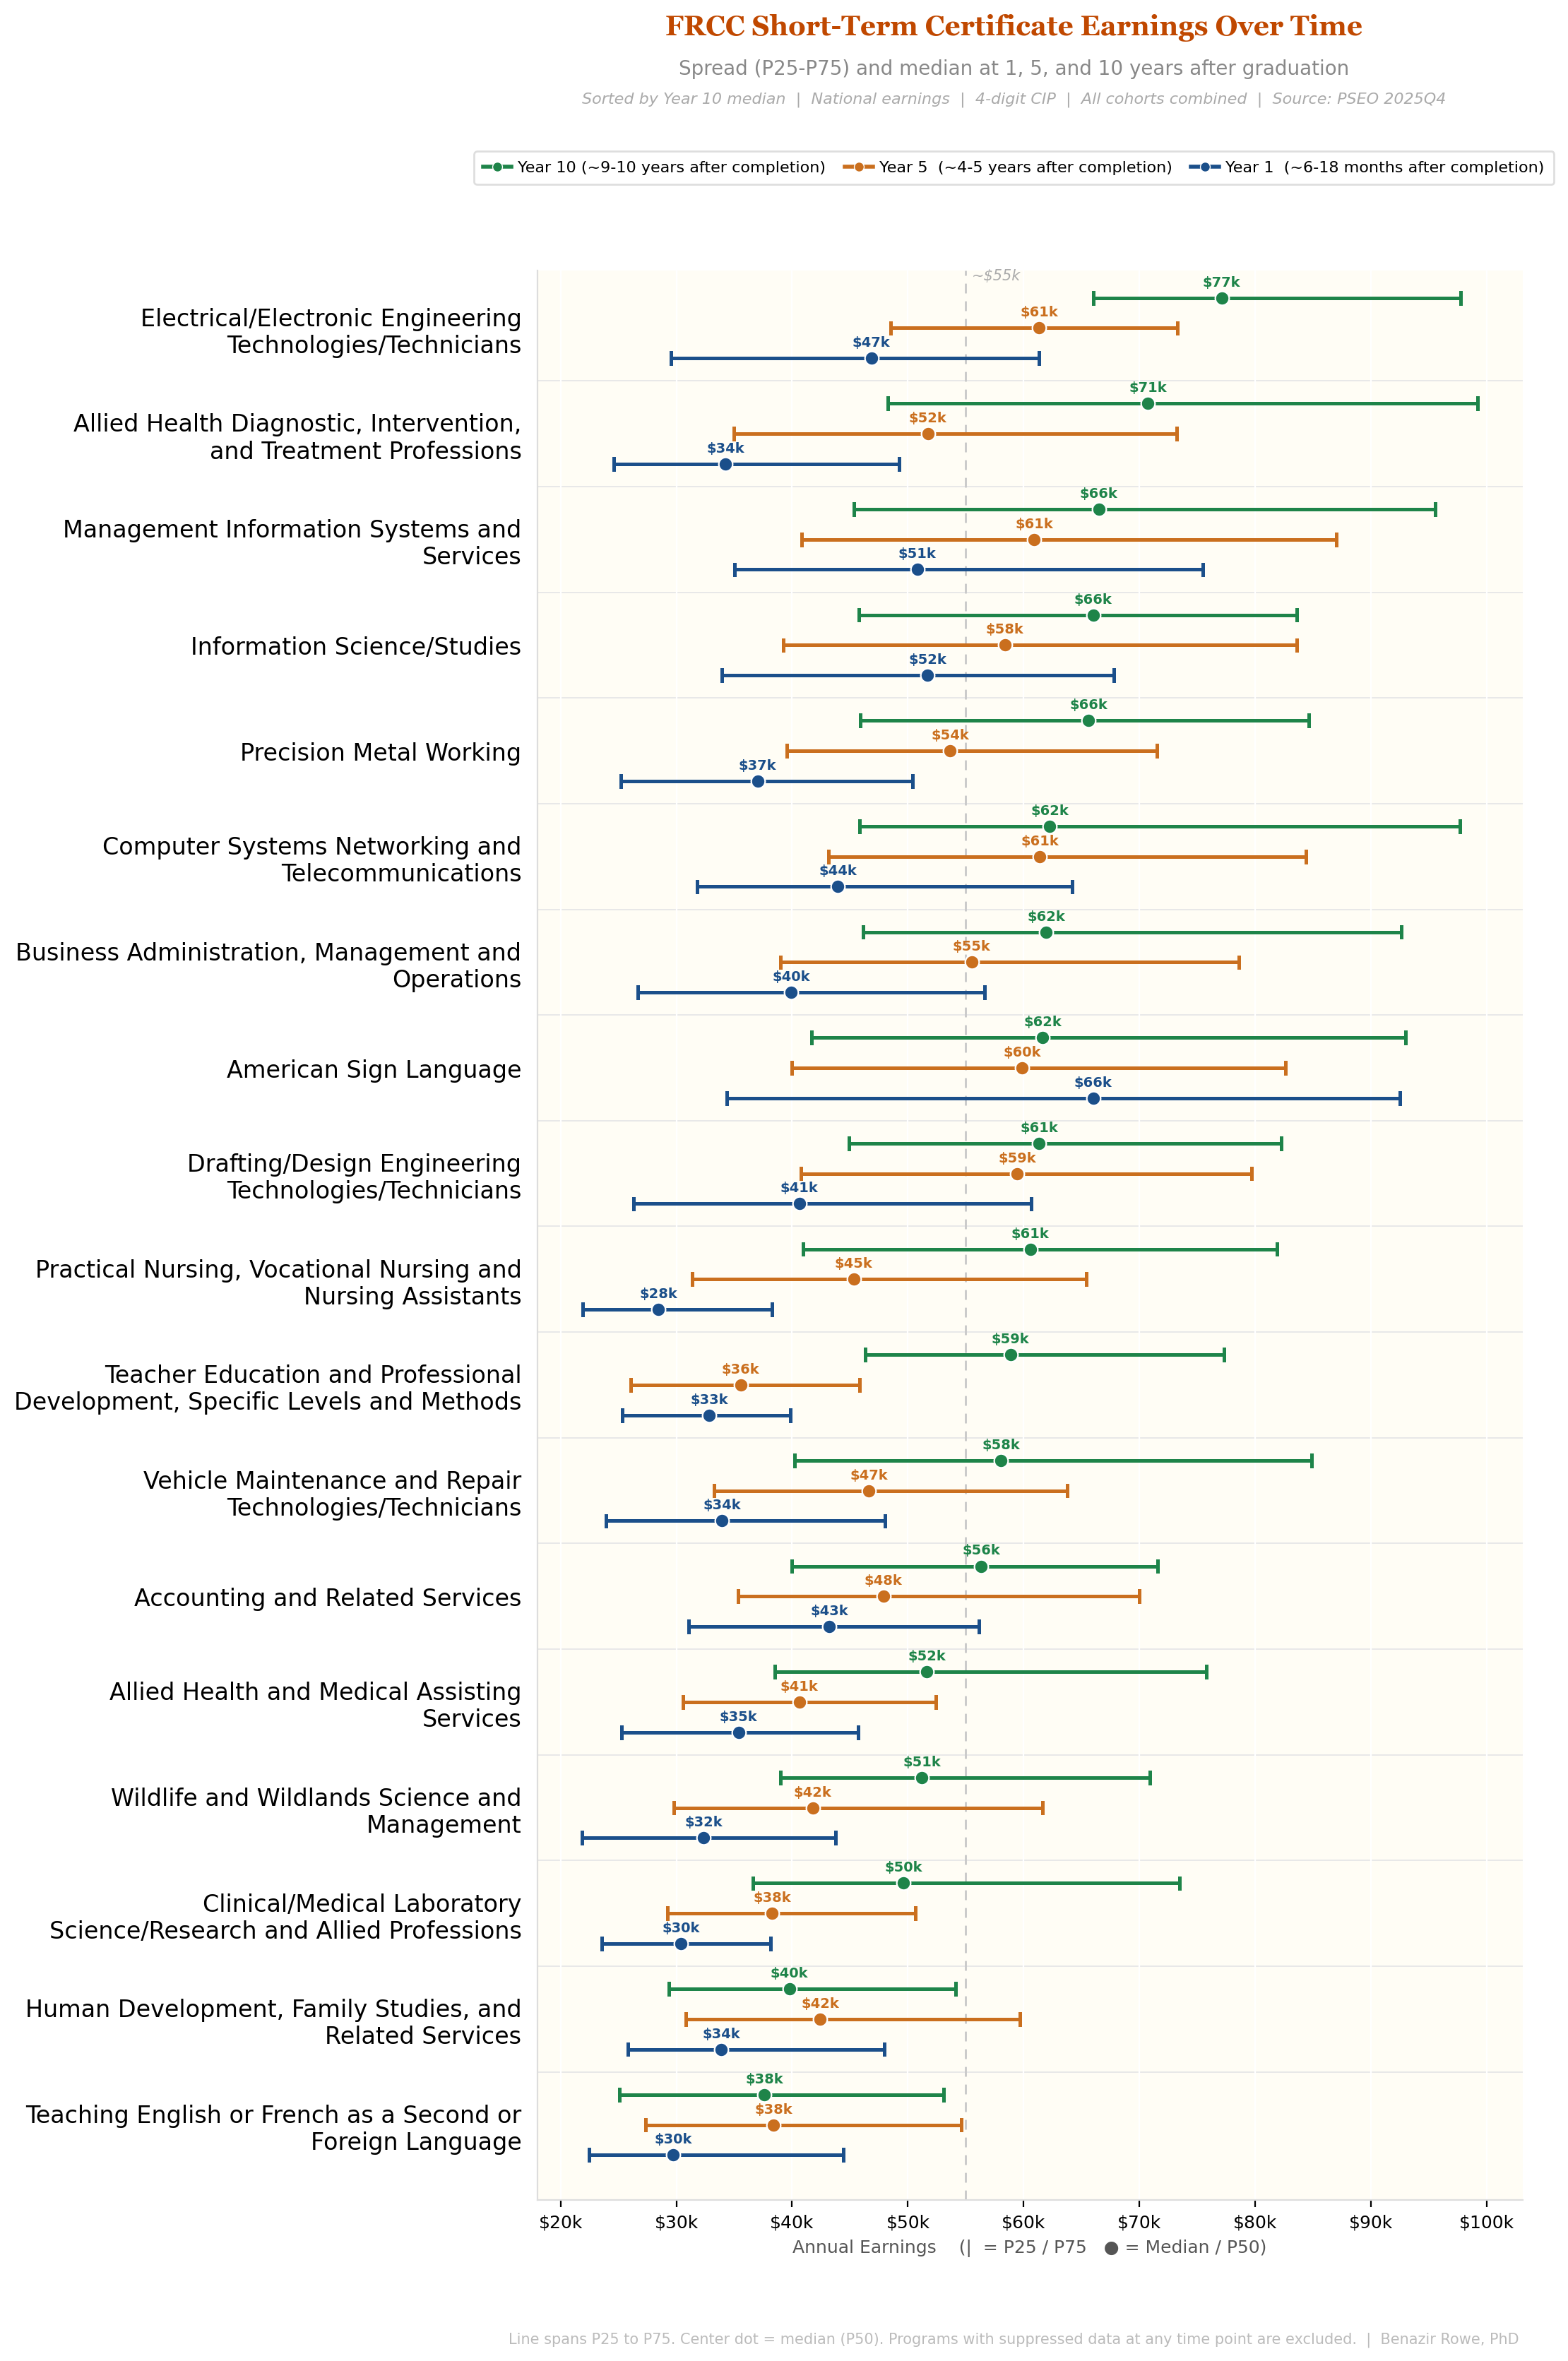
Several patterns are immediately visible. Many short-term certificates show substantial earnings growth over time, with programs like Electrical/Electronic Engineering Technologies, Allied Health Diagnostics, and several IT fields reaching $65k–$77k median earnings by Year 10—well above the statewide living wage benchmark. Perhaps more interesting is how misleading early earnings snapshots can be: programs such as Precision Metal Working or Vehicle Maintenance start with relatively modest wages but show strong mid-career growth. The widening spread between the 25th and 75th percentiles also suggests that these credentials can lead to diverging career paths, where experience, specialization, or advancement significantly shape long-term earnings.
Taken together, the pattern challenges a common assumption in the short-term credential debate. These programs are often evaluated based on early wage snapshots, but the more important story may be the trajectory of earnings growth over time.
From ROI to Real Career Outcomes
Many states are currently rethinking how higher education connects to workforce outcomes. One example is the Future-Ready States initiative from the Lumina Foundation, which encourages states to build stronger data systems linking education, employment, and economic mobility.
The premise is simple: if states want to design effective workforce pathways, they need better visibility into what actually happens to students after they leave college.
Datasets like PSEO move us closer to that goal. They allow institutions and policymakers to see not just whether graduates are employed, but how earnings evolve over time and how outcomes vary across individuals and programs.
This matters because the value of education cannot be captured by a single ROI number.
Careers are not one-time investments. They are paths: uneven, nonlinear, and shaped by opportunity over time. A program that produces lower income in year one may generate substantial mobility by year ten. Another may offer modest but predictable earnings. A third may produce wide dispersion: lower floors but much higher ceilings.
Those differences matter for students choosing programs, for institutions designing pathways, and for policymakers shaping workforce strategy.
If we want to understand how education actually translates into opportunity, we need to move beyond a single number and start looking at career ladders, variance, and the full distribution of outcomes.
Fortunately, the data to do that already exists.